The San Francisco Estuary is a complex watershed and home to many different species of wildlife. This R package uses images of the landscape and wildlife to create color palettes. Colors are extracted from images using https://colordesigner.io/color-palette-from-image. This package closely imitates the excellent work of the Manu and wesanderson packages.
Installation
This package is hosted on Github and can install it using the devtools package:
# install.packages("devtools")
devtools::install_github("MalteWillmes/sfecol")
Usage
The color palettes are stored as a list named sfe_palettes. Thus you can see a list of the available palettes like so:
library(sfecol)
names(sfe_palettes)
[1] "delsme" "chinook" "chinookcarc" "southbay" "baslu" "elpastel"
A helper function sfe_pal() returns the desited color palette as a vector: For example:
sfe_pal("delsme")
[1] "#304247" "#D1D0B3" "#828D6D" "#8DBA71" "#92A2AF" "#447484"
There is also a helper function called print_pal() which displays the palette in the graphics window.

Since the get_pal() function returns the color palettes as a character vector they can easily be used in the graphics package of your choice. Here are examples in both base R and ggplot2.
Color palettes
The data for the graphs shown below comes from the Palmerpenguins dataset. This dataset contains various measurments of 344 penguins from 3 different species of penguins, collected from 3 islands in the Palmer Archipelago, Antarctica.
Horst AM, Hill AP, Gorman KB (2020). palmerpenguins: Palmer Archipelago (Antarctica) penguin data. R package version 0.1.0. https://allisonhorst.github.io/palmerpenguins/. doi: 10.5281/zenodo.3960218.
delsme - Hypomesus transpacificus - Delta Smelt
c("#304247", "#D1D0B3", "#828D6D", "#8DBA71", "#92A2AF","#447484")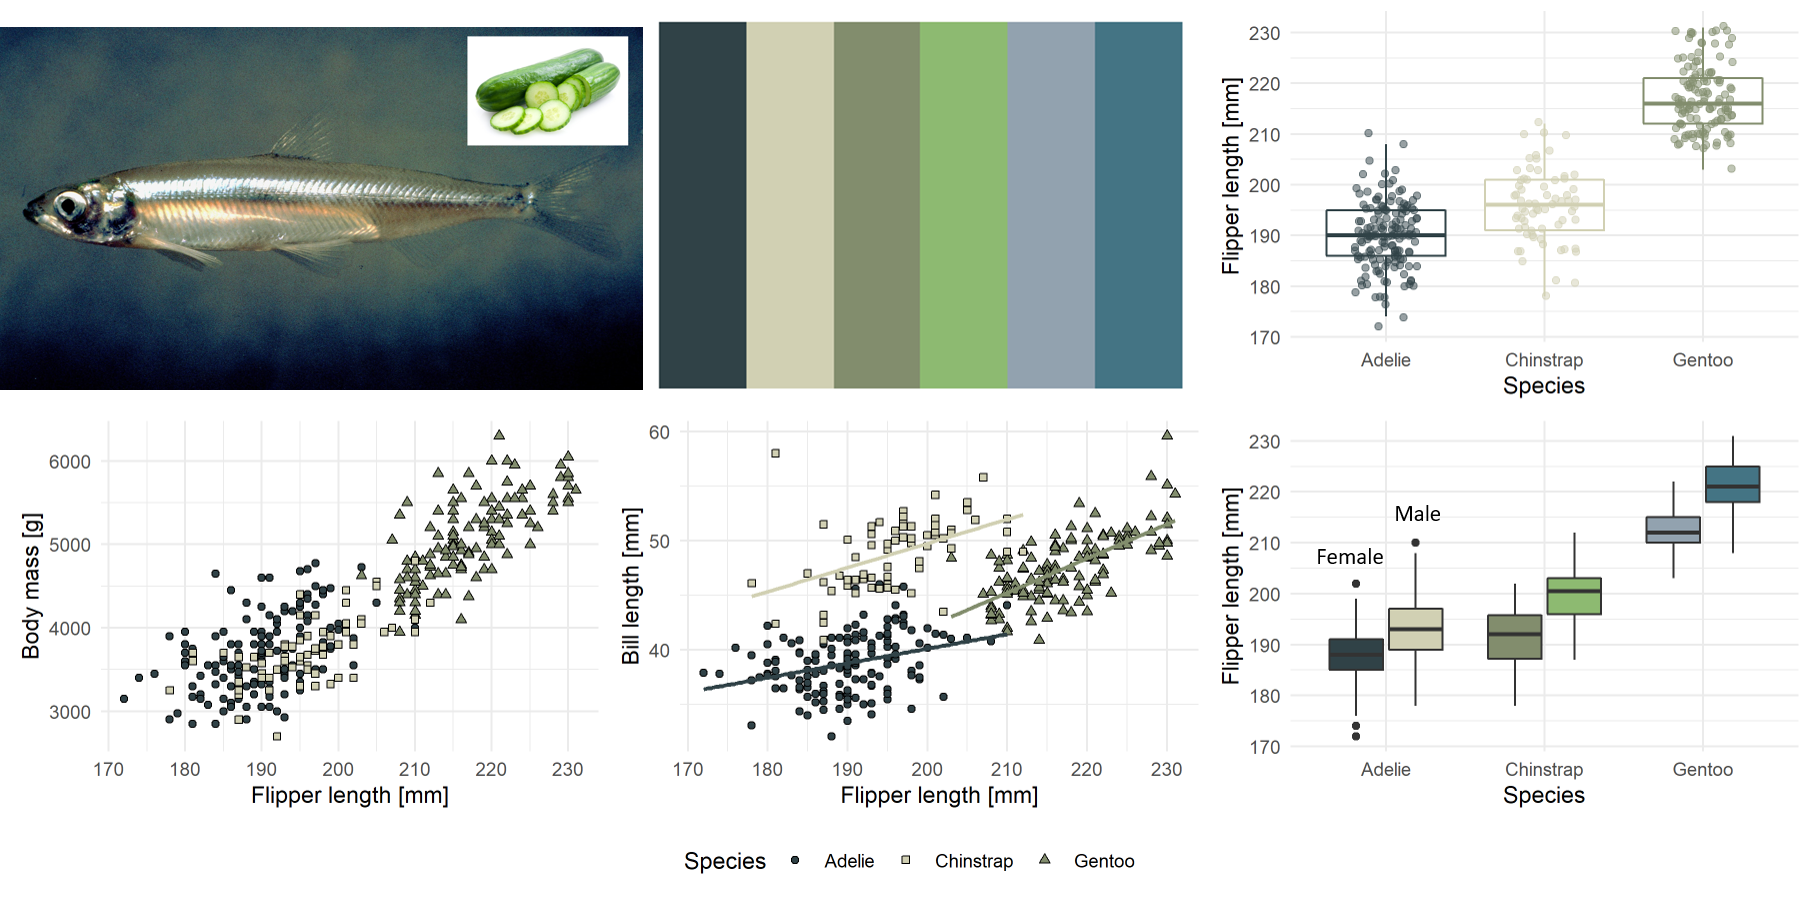 Image: The Delta Smelt has a typical cucumber smell to it. Photo by Peterson, B. Moose, U.S. Fish and Wildlife Service.
chinook - Oncorhynchus tshawytscha - Chinook Salmon
c("#899FBF", "#243158", "#543D4A", "#D8D9E4", "#715E4D", "#C0D5F0")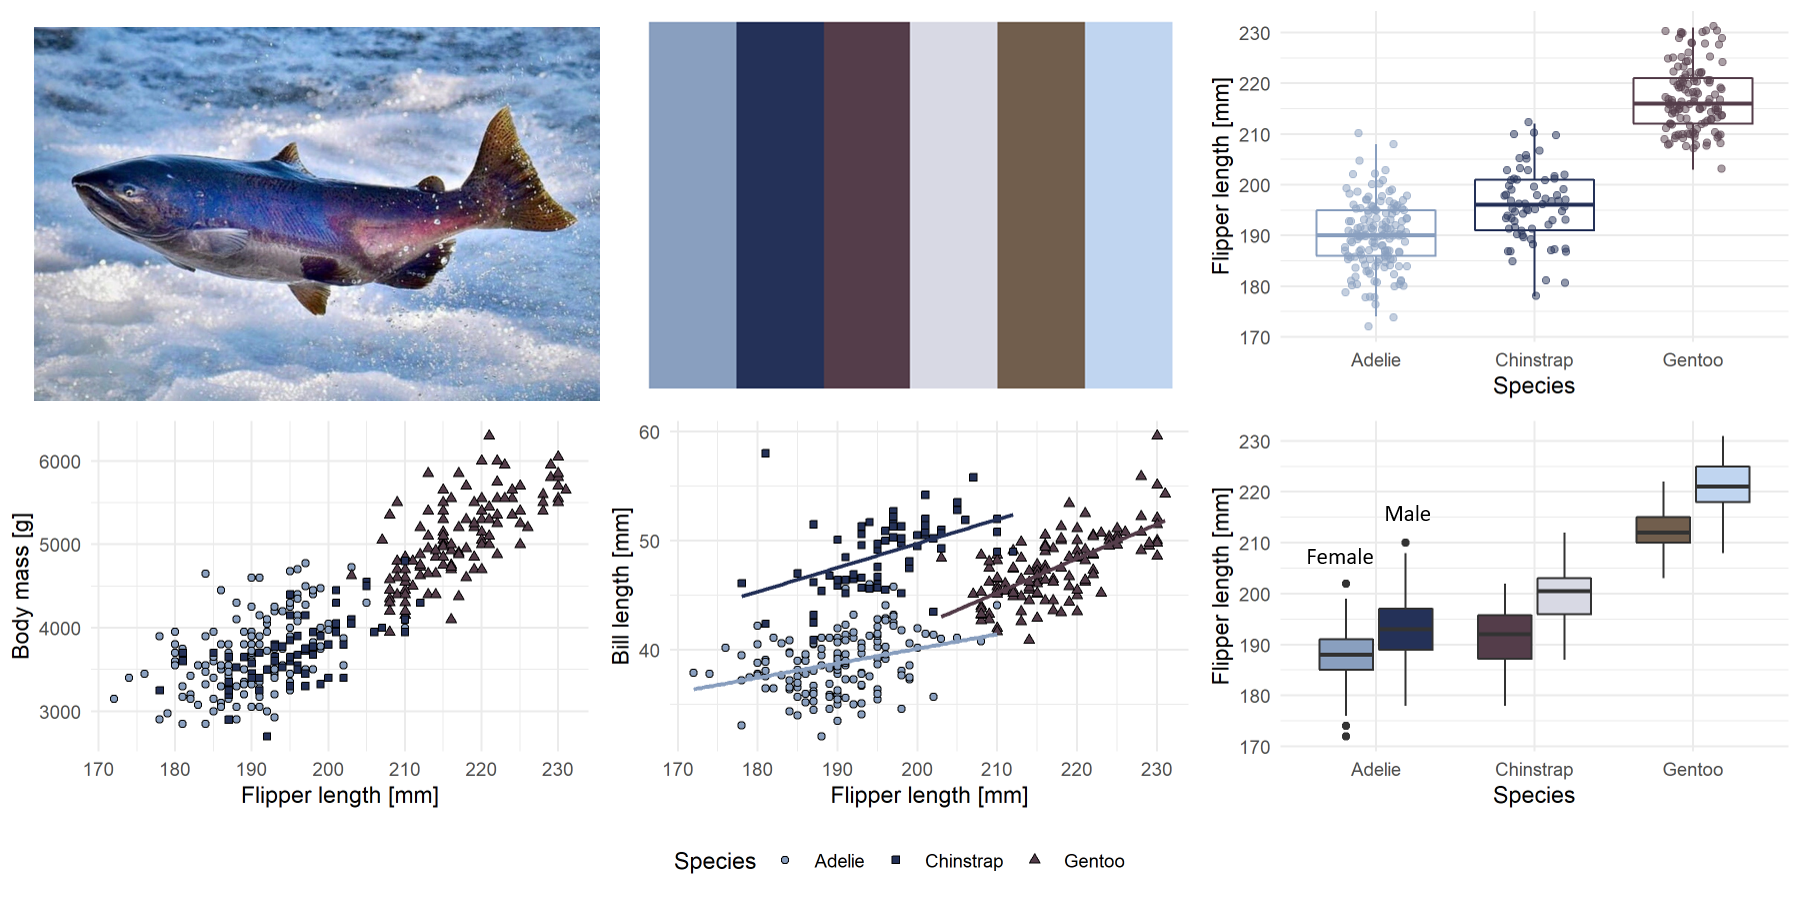 Image: A winter run Chinook Salmon in Battle Creek, CalTrout (https://caltrout.org/). Photo by Jane Work.
chinookcarc - Oncorhynchus tshawytscha - Chinook Salmon carcass on Putah Creek
c("#CDC9C0", "#2B2F2A", "#837C32", "#727877", "#634933", "#A89C6B")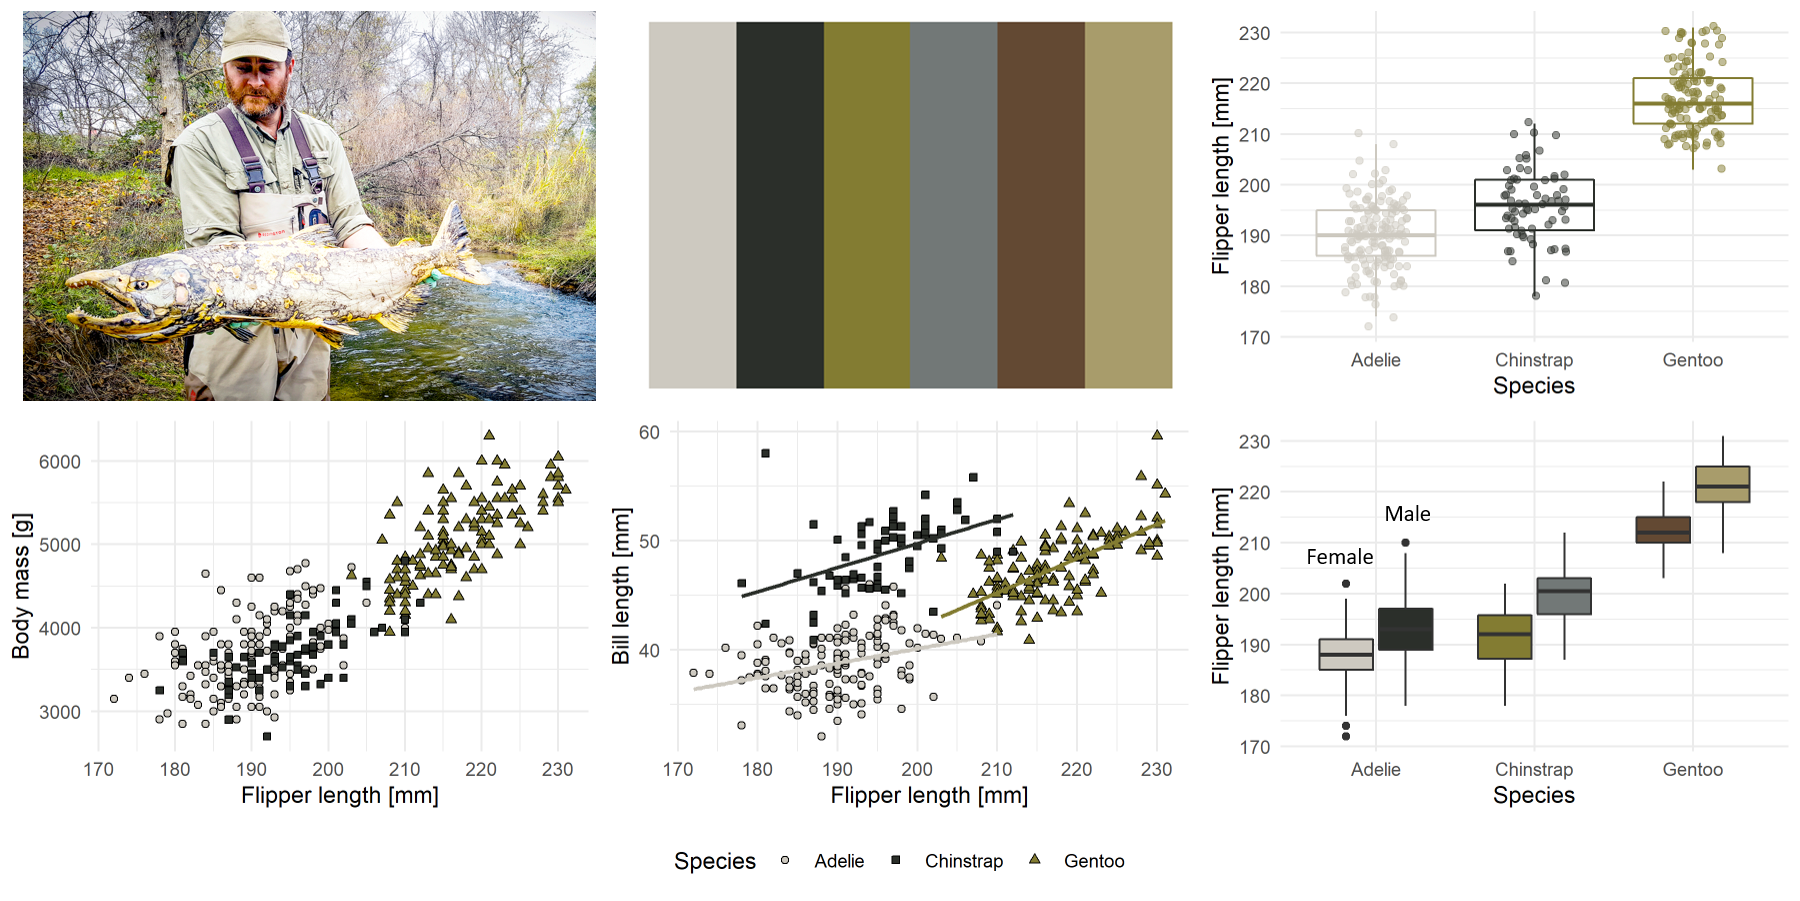 Image: A Chinook Salmon carcass on Putah Creek. Photo by Ken Davis.
southbay - Soutbay Salt Ponds
c("#727467", "#97CFCB", "#D5A54C", "#1F2F3D", "#801F23", "#633F47")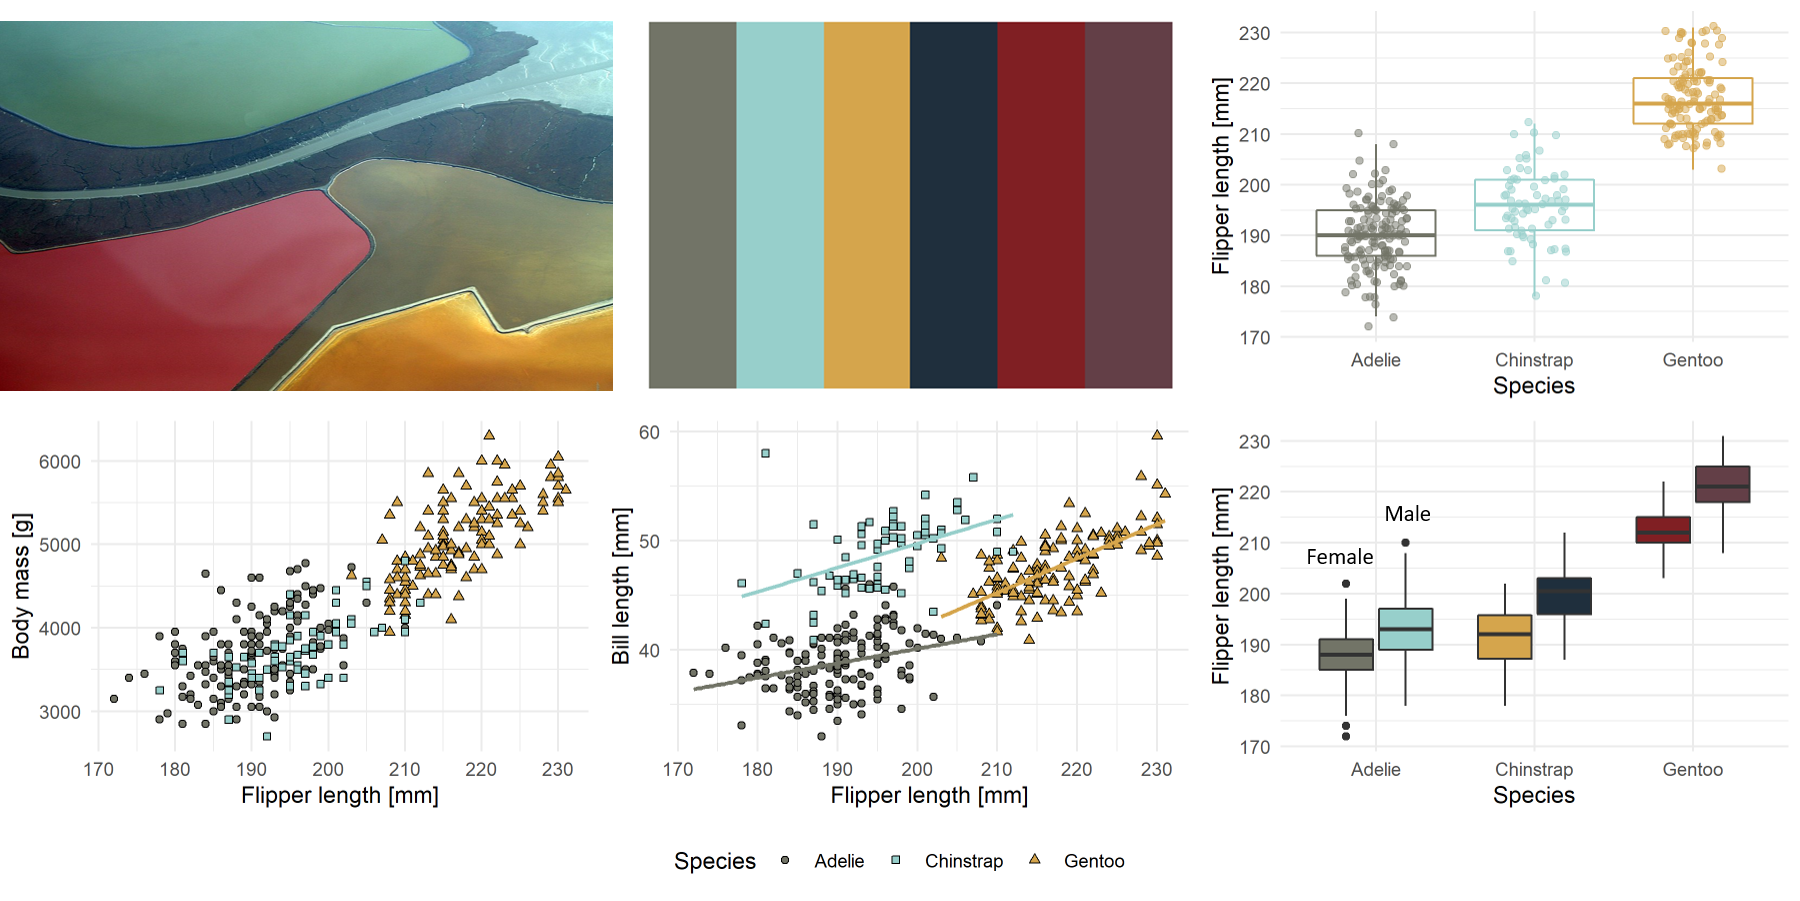 Image: Bird’s-eye view of the multi-colored salt ponds, Photo by Doc Searls from Santa Barbara, USA.
petaluma - Petaluma River
c("#DFDCD0" "#37322A" "#94908B" "#7A6863" "#857C6C" "#6C7C7E")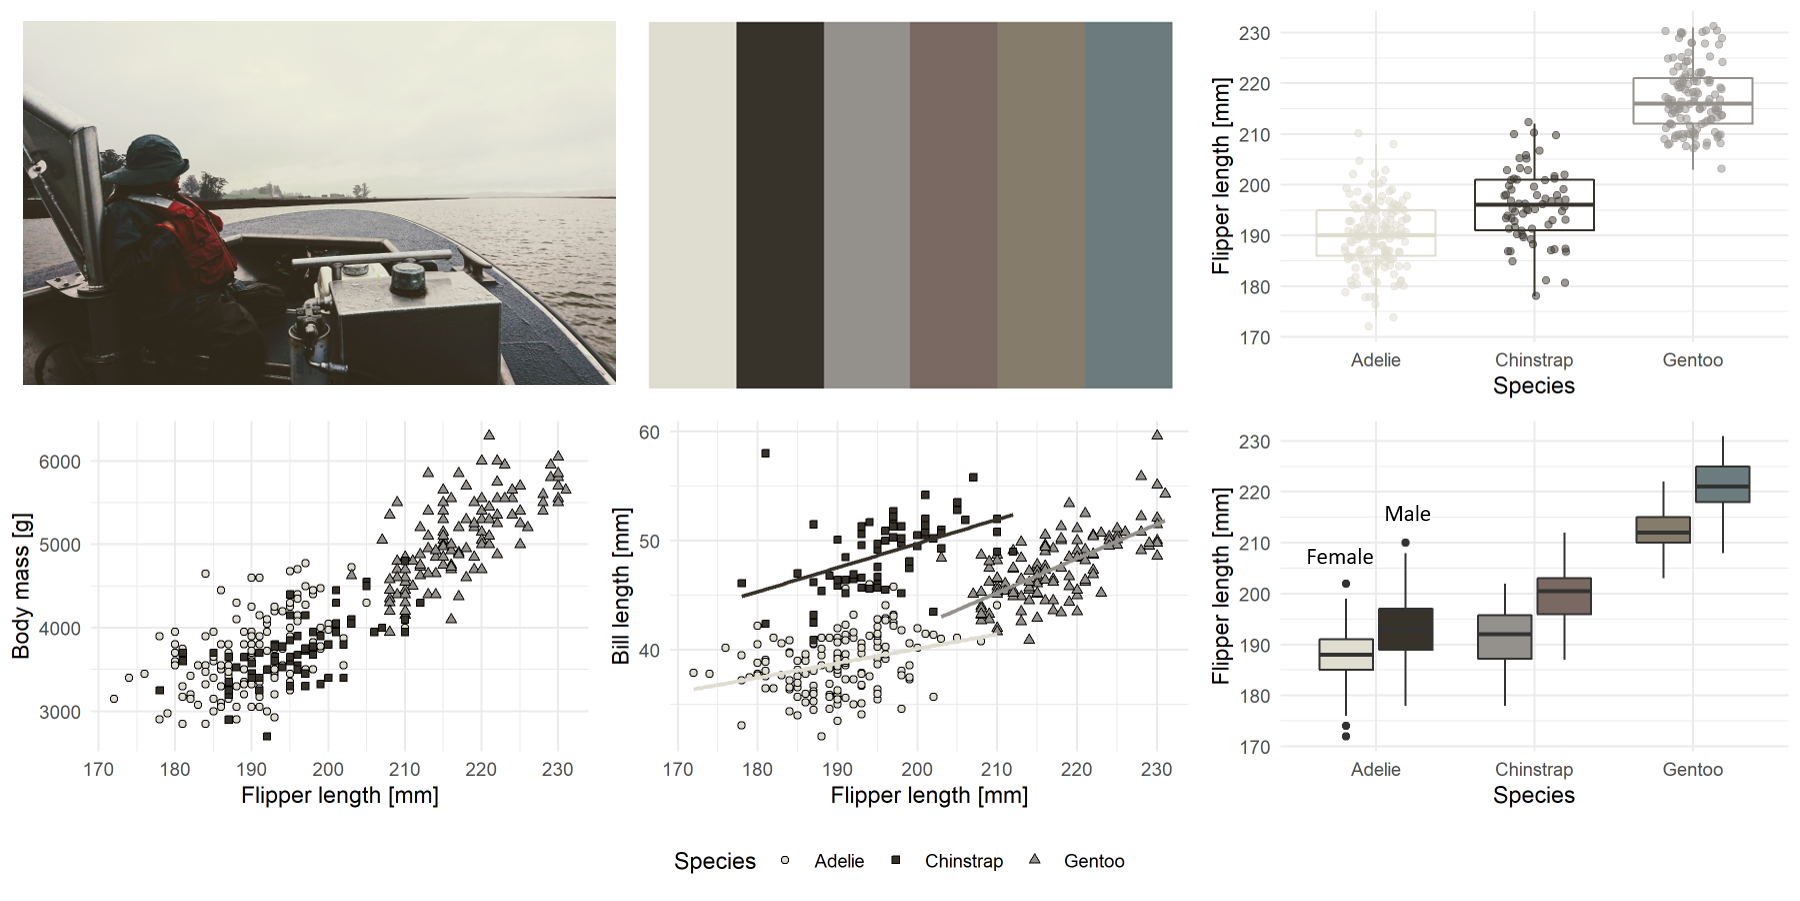 Image: Survey boat on the Petaluma River. Photo by Malte Willmes.
napa - Napa River
c("#D6C8B9" "#181618" "#8F959A" "#73615D" "#A64F40" "#4F575B")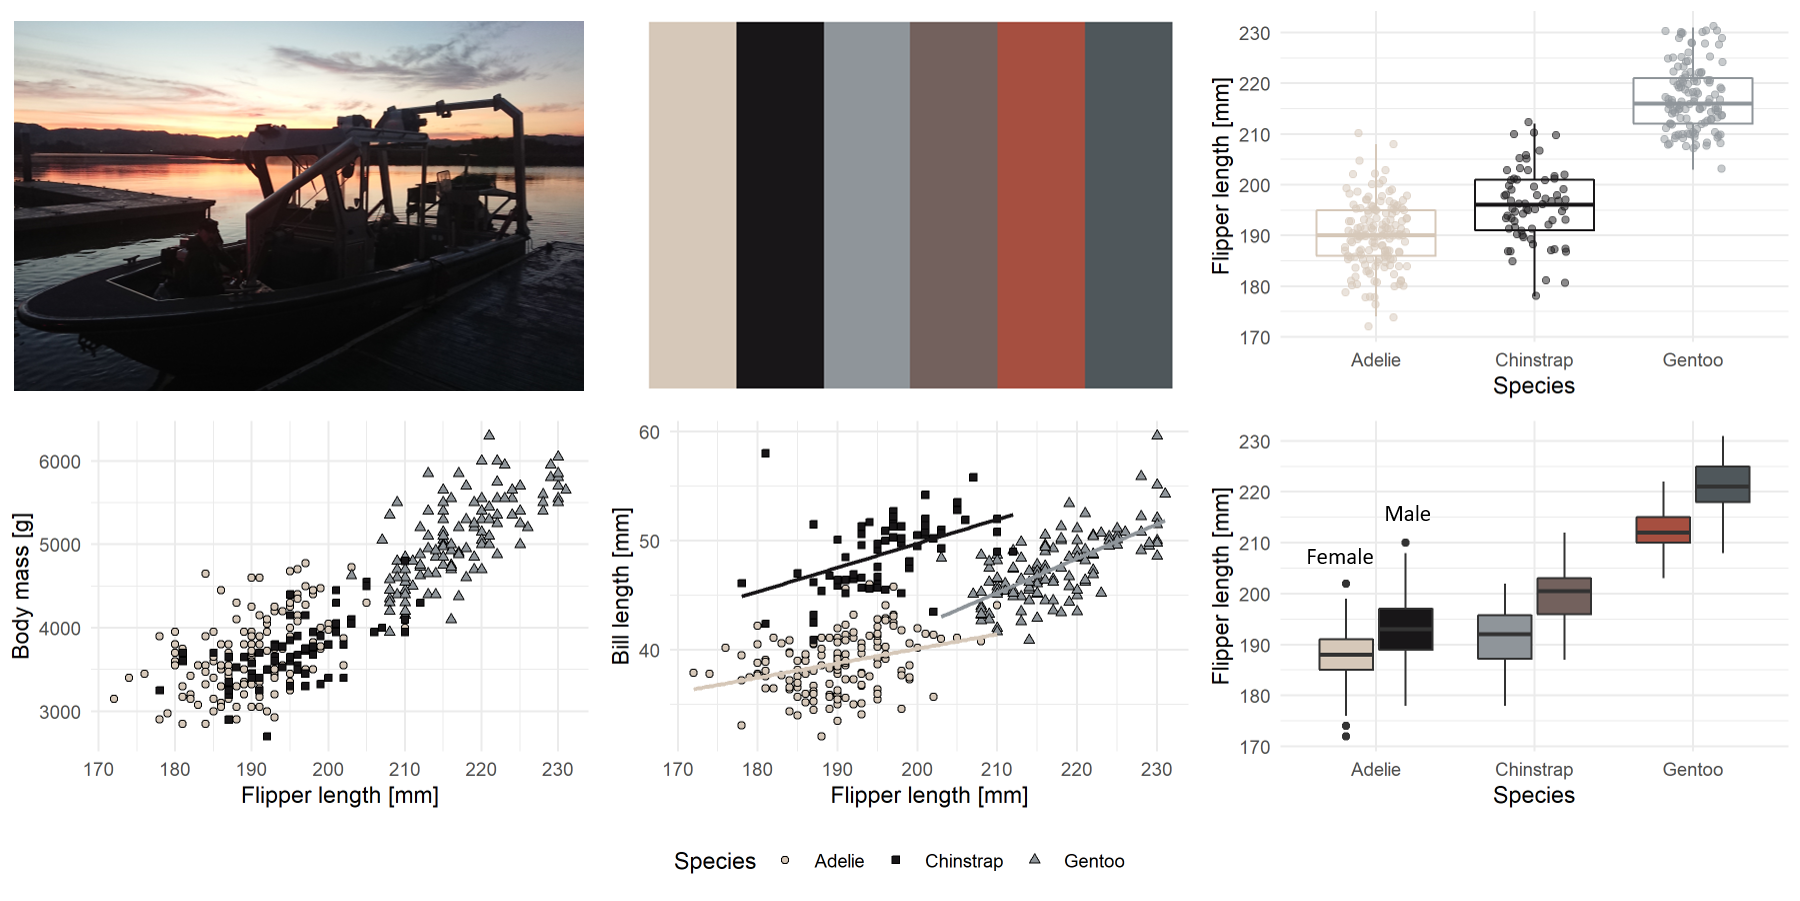 Image: Early morning on the Napa River. Photo by Malte Willmes.
baslu - Ariolimax columbianus - Banana slug
c("#6F7527", "#D0C56E", "#122006", "#AEB953","#3F2D0F","#9B9899")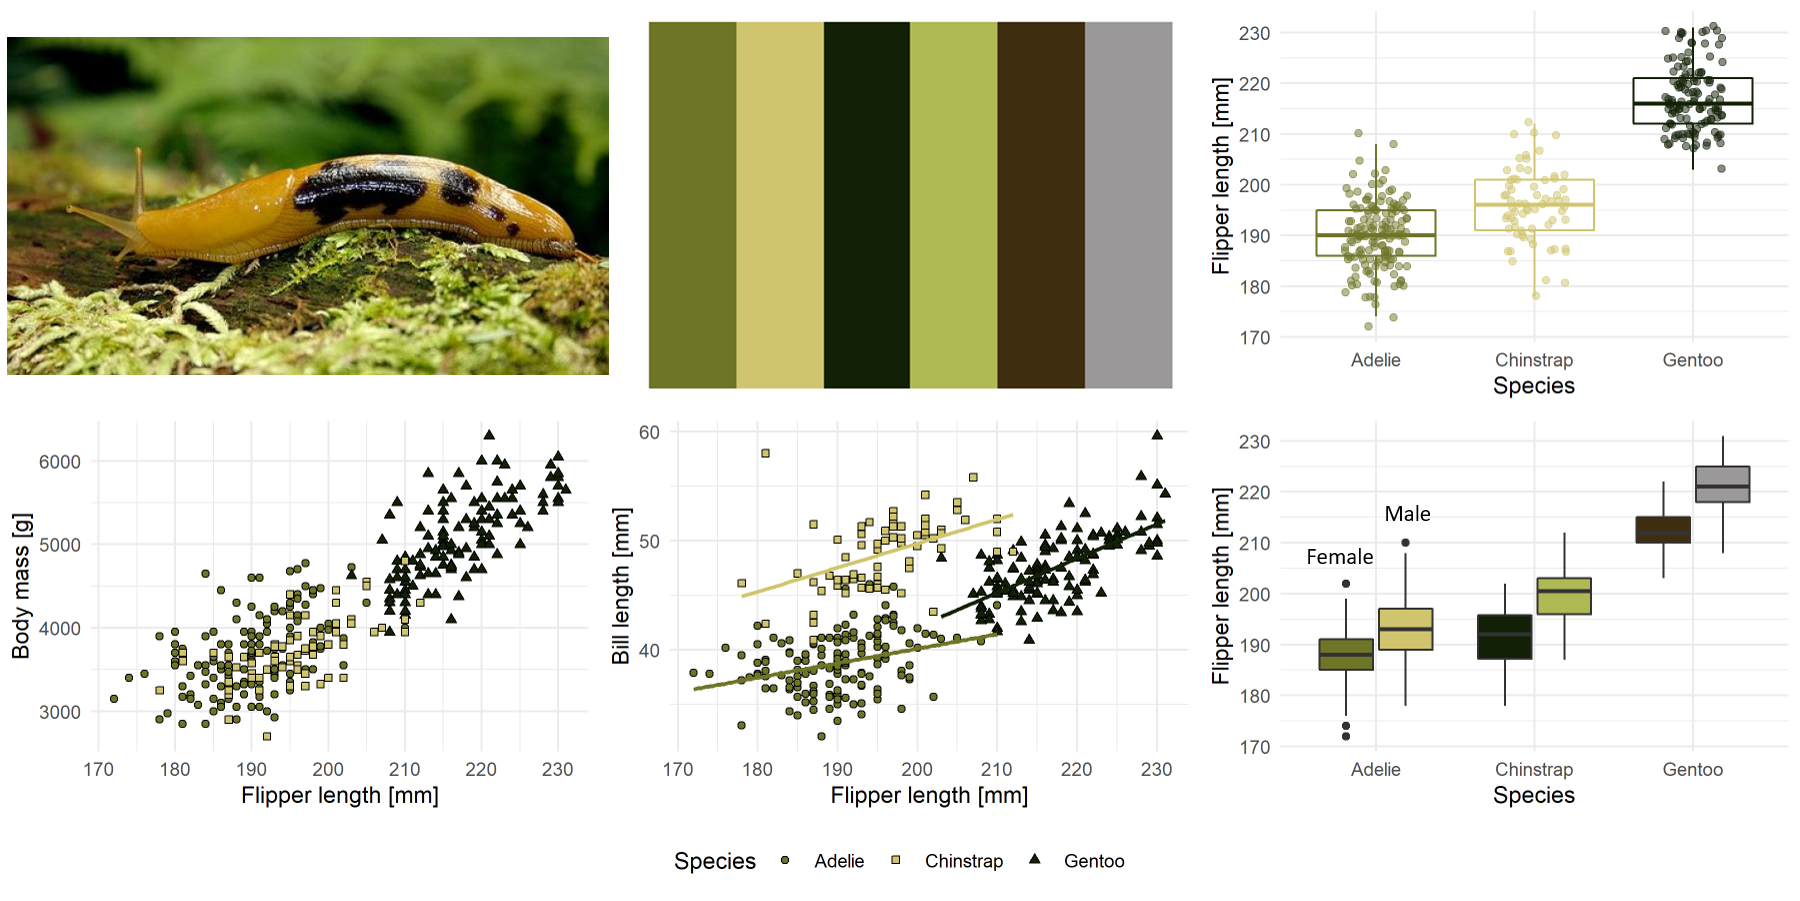 Image: A banana slug. Photo by Ben Stanfield.
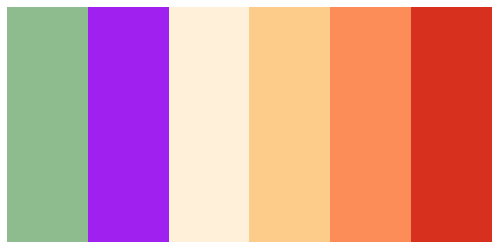
Color palettes not based on images
Here are additional color palettes that are not based on images but have proven to be useful to show SFE related data

Continuous color palettes
The color palettes in this package are designed for discrete variables. However if your data is continuous and needs to be plotted as such (e.g. heatmaps) you can use the colorRampPalette() already part of your R installation to create a color gradient.
For example, if you would like to create a color gradient between the 2nd and 3rd colors from the delsme palette you could do the following.
# Select 2nd and 3rd colors
selected_colors <- sfe_pal("delsme")[c(2,3)]
# Create a gradient of 100 colours between the selected colours
colorRampPalette(selected_colors)(100)